Reconciling 3× more clients with the same team
How a brokerage scaled benefits reconciliation service from 27 to 79 groups - without adding headcount
The Problem
Our brokerage client was reconciling carrier invoices for 27 employer groups — all in Excel.
Every month, the same cycle. Collect the data. Rebuild the tables. Run pivot tables and lookups. Try to match carrier invoices against enrollment data.
The problem? Timing differences that would resolve on their own looked exactly like actual billing errors. No easy way to tell them apart. Open items piled up month over month. Errors slipped through.
The lean team was at capacity. Growth meant hiring — or accepting lower reconciliation quality.
They moved to Tabulera's Benefits Reconciliation Module, integrated with Employee Navigator.
16 months later: 79 groups. Same lean team.
Key findings from 116,239 line items
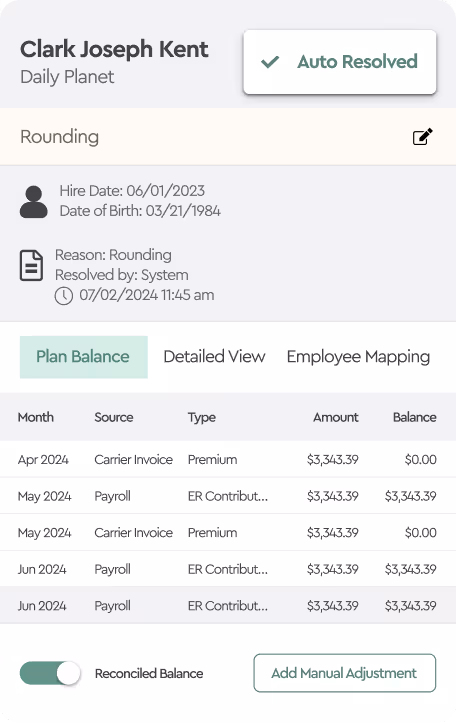
Finding 1 → 90.5% of line items auto-resolve
Out of 116,239 employee-line items, 105,173 were automatically matched — employee verified, rate confirmed, coverage tier validated.
No manual review required.
Finding 2 → Only 1–2% of line items are actually wrong
9.5% of items get flagged as variances. But the majority are timing differences — new hires or terminations that haven't synced to the carrier invoice yet. These typically clear the following month.
The items that are actually wrong — terminated employees, rate errors, missing coverage — represent approximately 1,200–2,300 line items per cycle (~1–2%).
Tabulera surfaces those immediately and provides the details needed to explain each variance. From there, the team either corrects the enrollment in Employee Navigator or notifies the carrier — and the following month's adjustment invoice auto-resolves the open items.
Finding 3 → Ghost Employees (terminated employees still being billed) are the #1 variance type (45.3%)
Analysis of the 11,066 flagged variances:
- Ghost Employees — 45.3% (5,012 items) Terminated in the HRIS. Still on the carrier invoice.
- Wrong Rates — 35.1% (3,889 items) Carrier charges don't match Employee Navigator.
- Missing Coverage — 14.1% (1,562 items) Enrolled in the HRIS. Carrier has no record.
- Plan/Tier Mismatch — 5.4% (603 items) Coverage level differs between sources.
Summary
Tabulera gave this brokerage something Excel never could: the ability to stay lean and serve more clients without sacrificing reconciliation quality.
The data shows three things:
- Benefits reconciliation at scale doesn't require more people — it requires automation that handles the 90% that matches, so humans focus on the 1–2% that doesn't.
- Variance categorization matters. Knowing why something doesn't match (ghost employee vs. wrong rate vs. missing coverage) determines whether it needs action now or will resolve next month.